The OED system has a number of features. This page gives a brief description of the feature along with a link to the help pages with more information and pictures. The academic uses example page shows many of these features but focusing on how they might be used. Some people may wish to see a number of these features by using our live demo site.
OED acquires, permanently stores and analyzes data it receives. While this is important in allowing OED to have the features on this page, it is not normally visible to the user and is not discussed here. If you are interested in how OED does this work then please contact the project.
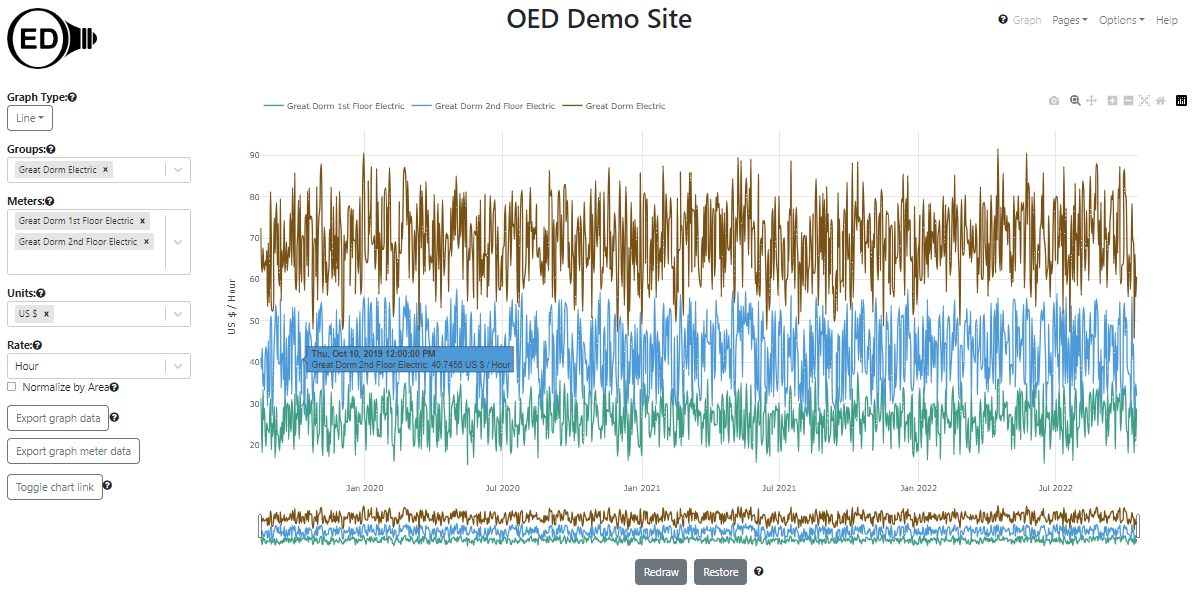
One can choose any compatible graphing unit to display the data. In the following figure, the same data is displayed as cost in U.S. dollars. OED supports virtually any unit including CO2, weight, volume, temperature, power (kW, etc.) where new units can be created by a site. Every graphic support one choosing the desired unit for display.
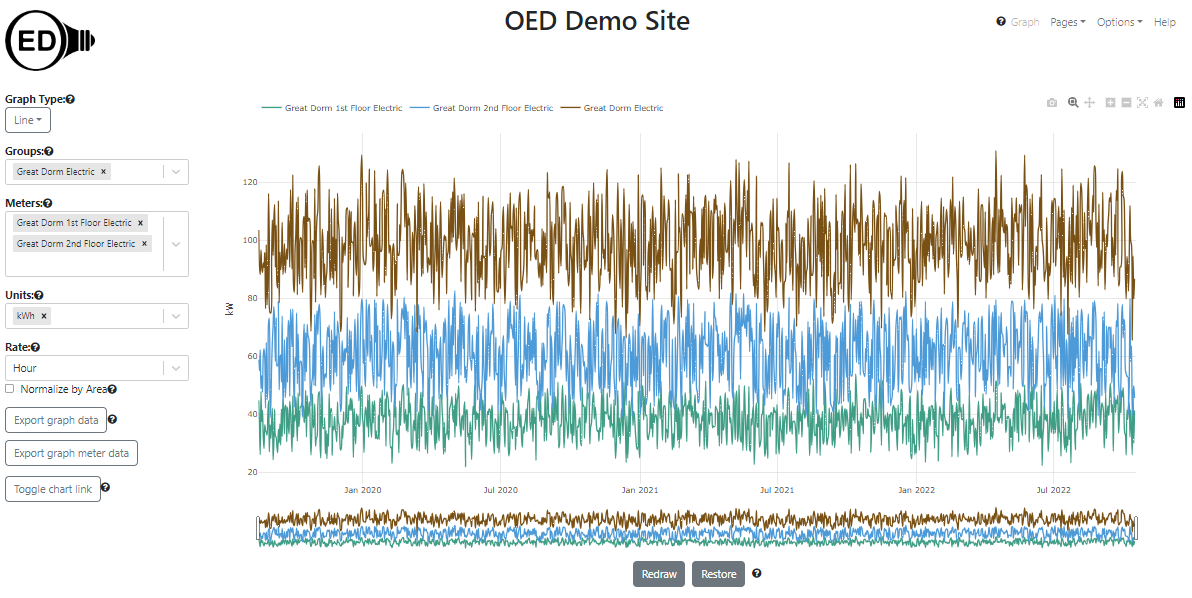
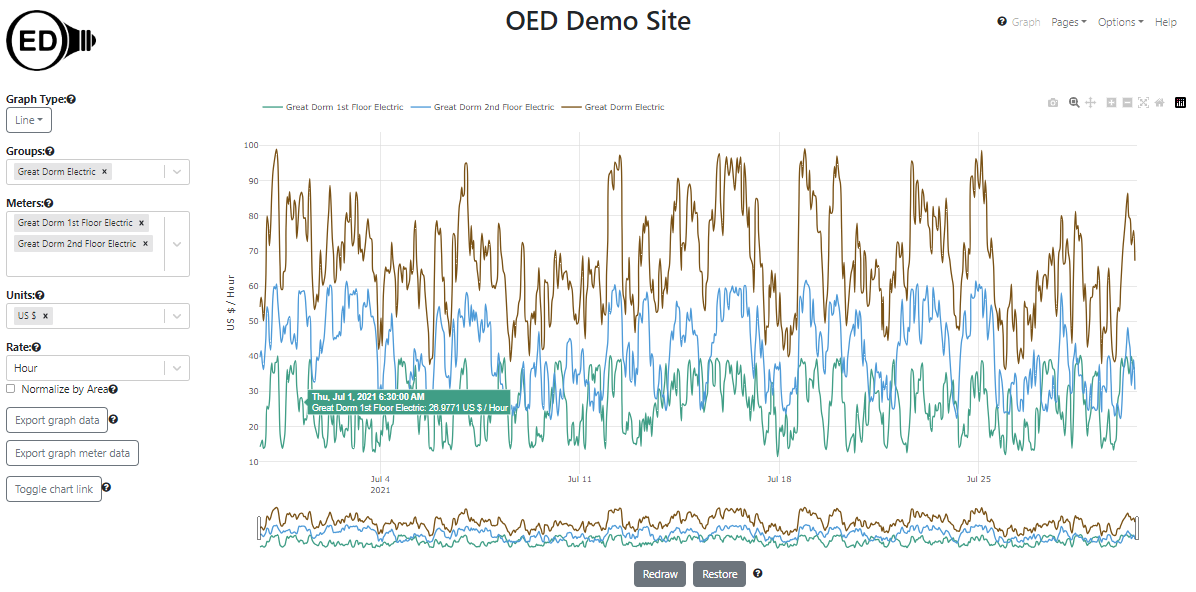
OED optimizes the time shown between points on a line graphic. This allows each point to be separate along with speeding up graphing requests while minimizing the network traffic. In the previous line graphic examples, each point represented the average usage over one day. Since there was about three years worth of data (16 August 2019 to 16 October 2022), there are 1157 days with that many points on the graphic. This is why the hover information shows 12:00:00 PM for each point because that is the middle of each day/point. While this is useful, sometimes you want to see more detail. In the following figure, the rectangles at the bottom of the graphic were dragged to contain July 2021 and the graphic was then redrawn. The hover now shows thirty minutes into the hour since that is the middle of that point that spans one hour. There are approximately 31 days * 24 hours/day = 744 hourly points in this graphic.
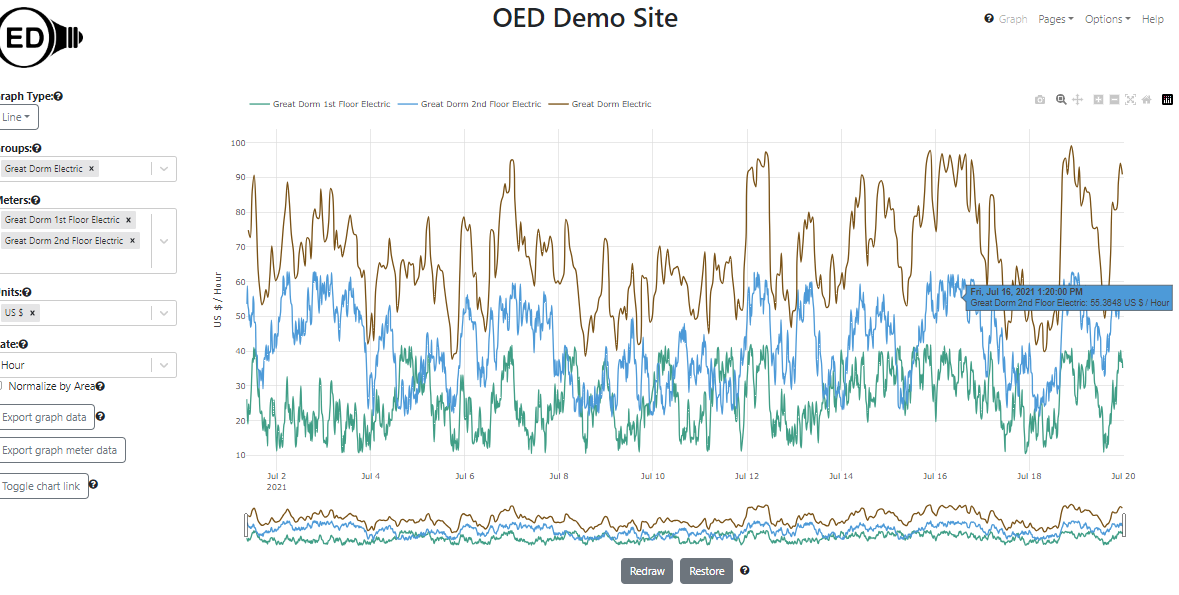
If you continue to zoom in on days then you will see the original meter readings. In the following figure, the dates were modified to be the first 20 days in July. The hover now shows 20 minutes past the hour because that meter reads data every 20 minutes (the reading goes from 10 past the hour to 30 past the hour on this meter). There are 20 days * 24 hours/day * 3 readings/hour = 1440 readings on this graphic.
OED will give the highest quality (shortest time between points) for each meter that it can given the date range of the graphic.
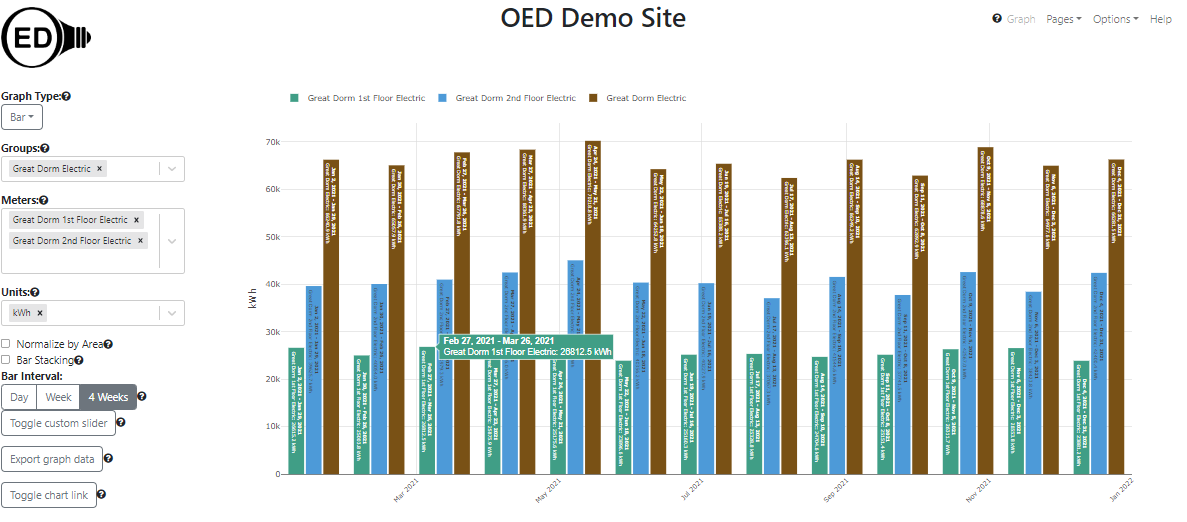
There are several bar graphic options. One allows for predefined day, week and 4 weeks bars or one can select between 1 to 365 days if those are not desired. You can also stack the bars rather than having them next to each other for each date range shown.
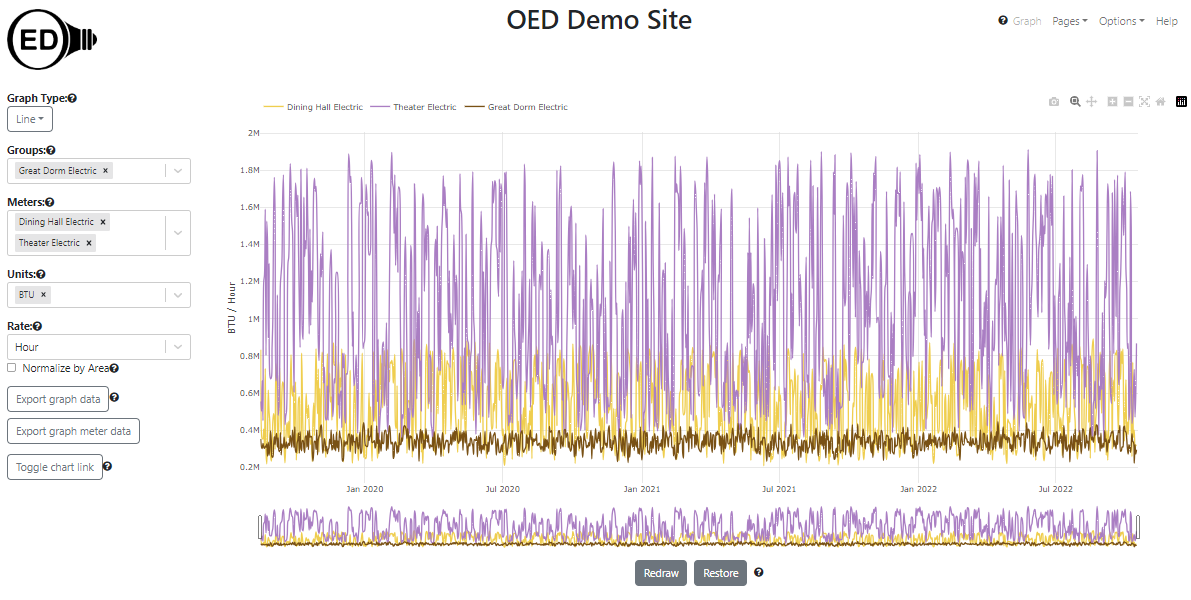
In the next graphic, the option to "Normalize by Area" is selected. Note the y-axis units are now "BTU / Hour / sq. meters". The area of the the Theater is 10,000 sq. meters, the Dining Hall is 1,000 sq. meters and the Great Dorm is 10,000 sq. meters. Thus, when normalized by area, the Theater is substantially below the Dining Hall because it is 10 times larger. There is no change between the Theater and Great Dorm because they are the same area. Clearly the Theater is either used differently or is much more efficient compared to the Dining Hall.
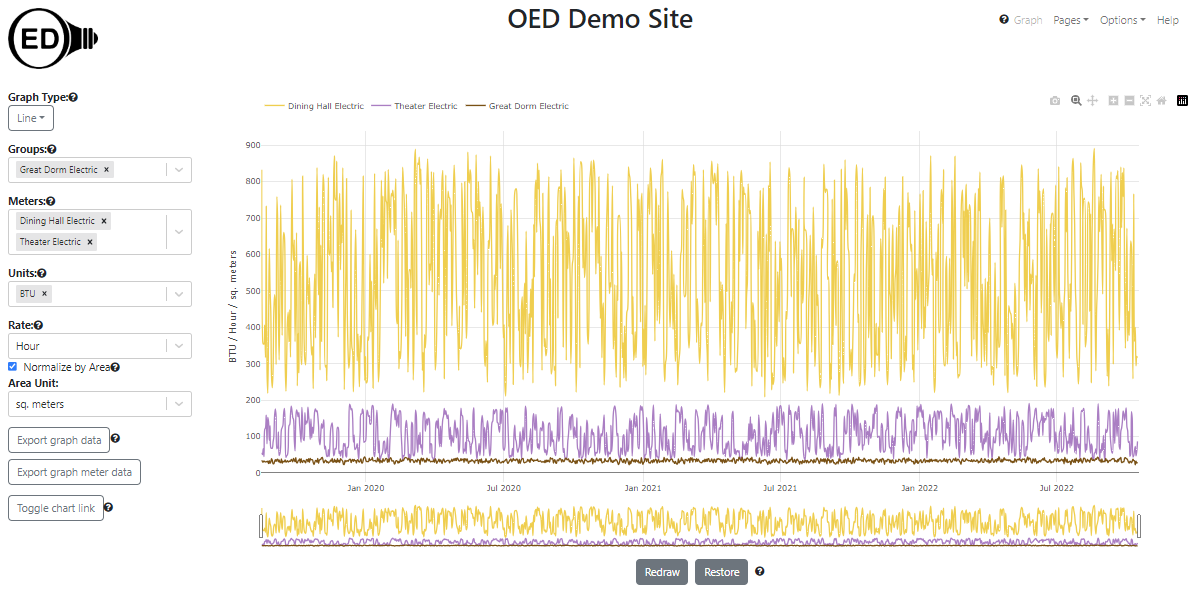
One can normalize by either sq. meters or sq. feet independent of the area unit for a meter/group.