The info on this page is for OED version 0.6.0. See "Help versions" menu at top of page for other versions.
Groups aggregate data as explained on the group graphing help page. To understand what data is included in a group, the groups page is available.
Click on the "Groups" page choice (see Page Choices for information on doing this). Once done, you will see what is in the next figure (for this demo site).
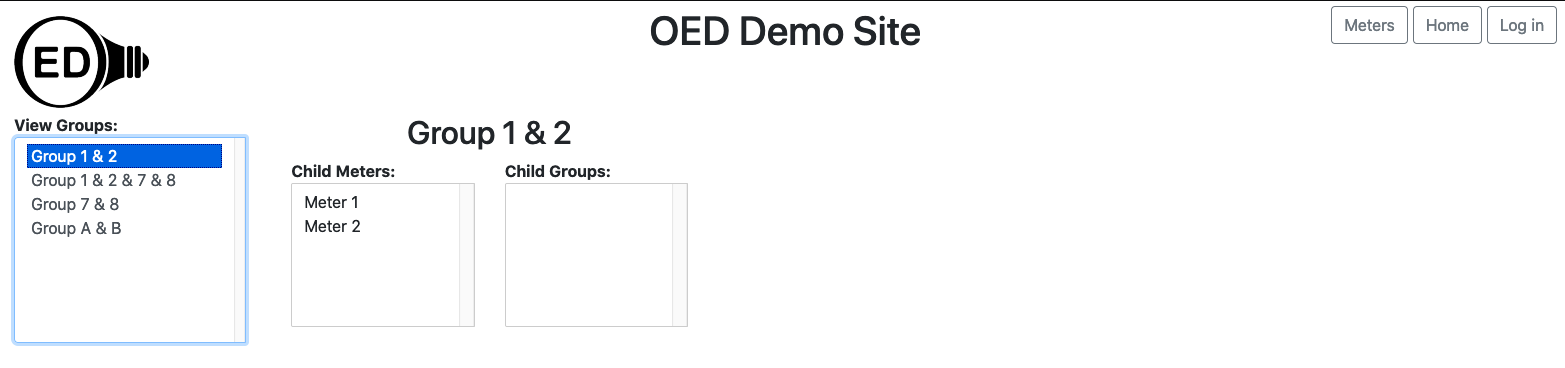
"Group 1 & 2" is highlighted which means its contents are being shown. The "Child Meters:" box has "Meter 1" and "Meter 2" which indicates this group includes those two meters. The "Child Groups:" box is empty indicating that no groups are included. Overall, this means graphing "Group 1 & 2" would show the sum of "Meter 1" and "Meter 2".
If you click on "Group 1 & 2 & 7 & 8" in the "View Groups" box (becomes highlighted in blue) then you will see the following.
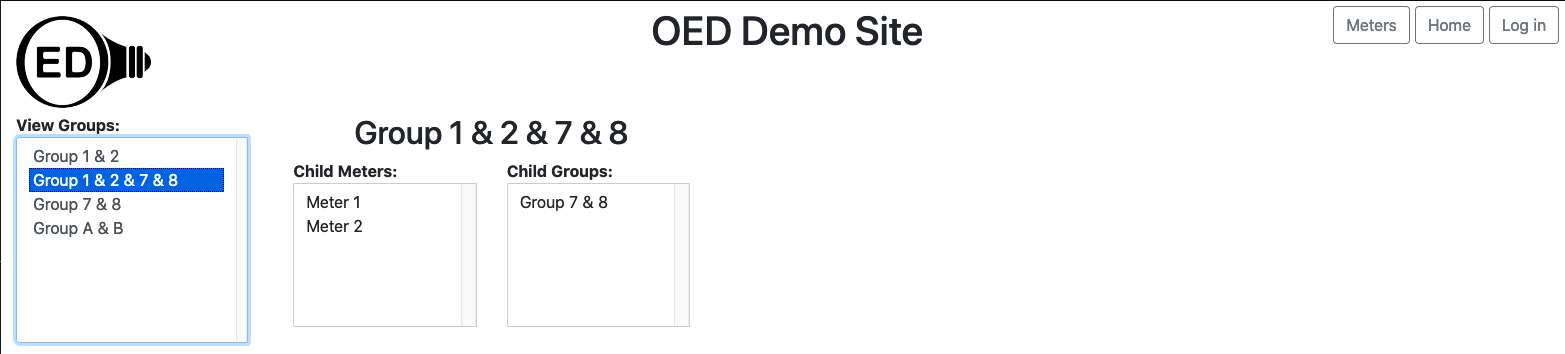
The "Child Meters:" box has "Meter 1" and "Meter 2" which indicates this group includes those two meters. The "Child Groups:" box has "Group 7 & 8" indicating that this group includes that group. To determine the meters involved, click on "Group 7 & 8" in the "View Groups:" box (becomes highlighted in blue) and then you will see the following.
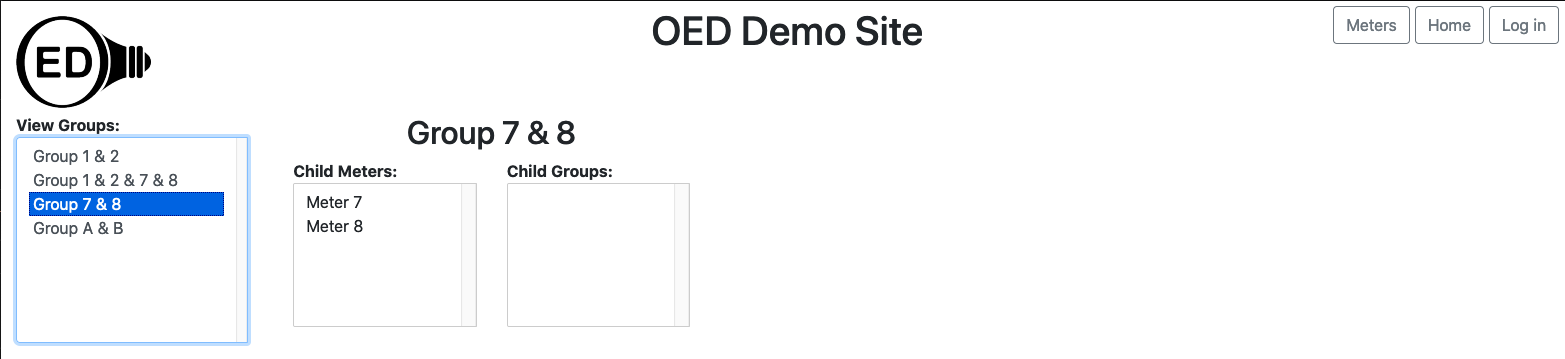
The "Child Meters:" box has "Meter 7" and "Meter 8" which indicates this group includes those two meters. The "Child Groups:" box is empty indicating that no groups are included. Overall, this means graphing "Group 1 & 2 & 7 & 8" would show the sum of "Meter 1", "Meter 2", "Meter 7" and "Meter 8".
Admins can see other details about groups as explained on the admin groups help page