The info on this page is for OED version 1.0.0. See "Help versions" menu at top of page for other versions.
OED is an open system that believes your site data belongs to you and should be readily available. The ability to export data is the feature that lets you get the data. You may want to do this to work on it outside OED or to transfer the data to another system. OED uses the vendor neutral CSV (Comma Separated Value) spreadsheet format for exported data.
The export feature gives the data associated with the graphic you are displaying. This means one can select meters/groups, time ranges to plot, units, etc. and visualize them in OED before one exports the data. Once the graphic contains the data one wants, one can either click the "Export graph data" button or "Export graph meter data" button (both inside blue box in next figure) to initiate the export. Note that in this figure the data has been normalized by area, the rate has been made per minute and the dates zoomed to about two months .to demonstrate that export works with many features.
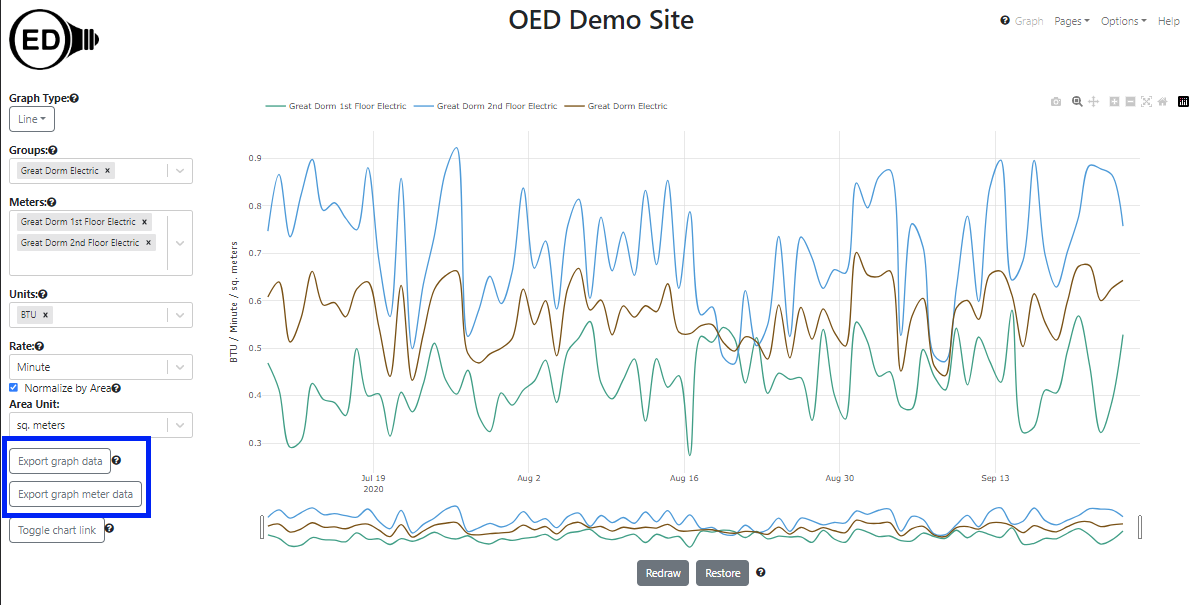
The "Export graph data" will give you the points on the OED graphic that is being displayed. The size of the exported files will not be large because you are getting the graphic points as described in the line graphic details. The "Export raw graph data" will give you the original (raw) meter data that was used to create the graphic. Since this is the raw meter data, group data on display in the graph are not included in the export of raw data.
When you click the "Export graph data" button in the figure above, one will get three files named: "oedExport_line_July_16_2020_12_00_00_AM_to_September_24_2020_12_00_00_AM_Great Dorm 1st Floor Electric_BTU.csv", "oedExport_line_July_16_2020_12_00_00_AM_to_September_24_2020_12_00_00_AM_Great Dorm 2nd Floor Electric_BTU.csv" and "oedExport_line_July_16_2020_12_00_00_AM_to_September_24_2020_12_00_00_AM_Great Dorm Electric_BTU.csv". There is one file for each meter or group. The name of the file has the following information separated by underscores:
Note the file name does not include the rate or if it has area normalization. It is unusual to export with these changed but if that is done you will have two files with similar names with different information.The header row described below will tell which is which inside the file.
The files in this example for "Export graph data" are: Great Dorm 1st Floor Electric, Great Dorm 2nd Floor Electric and Great Dorm Electric. The first row in the csv file is a header row with the following columns:
When you click the "Export graph meter data" button in the figure above, one will get two files named: "oedRawExport_line_July_15_2020_9_10_00_AM_to_September_24_2020_3_30_00_PM_Great Dorm 1st Floor Electric_BTU.csv" and "oedRawExport_line_July_15_2020_9_10_00_AM_to_September_24_2020_3_30_00_PM_Great Dorm 2nd Floor Electric_BTU.csv". The differences from the "Export graph data" import are:
The files in this example for "Export graph meter data" are: Great Dorm 1st Floor Electric and Great Dorm 2nd Floor Electric
The size of this CSV file scales with the number of meter points and can be large. To avoid accidental or inappropriate downloads of large files, OED does the following:
Note that you will be told you cannot download the data if you don't have appropriate privileges. The download of the meter data as a CSV will take longer than the network transfer time because OED must get the data from the database and format into a CSV.
Exporting bar graphics data is similar to line graphics with these differences:
Using the same example as for line you get the following figure when graphing the bar data:
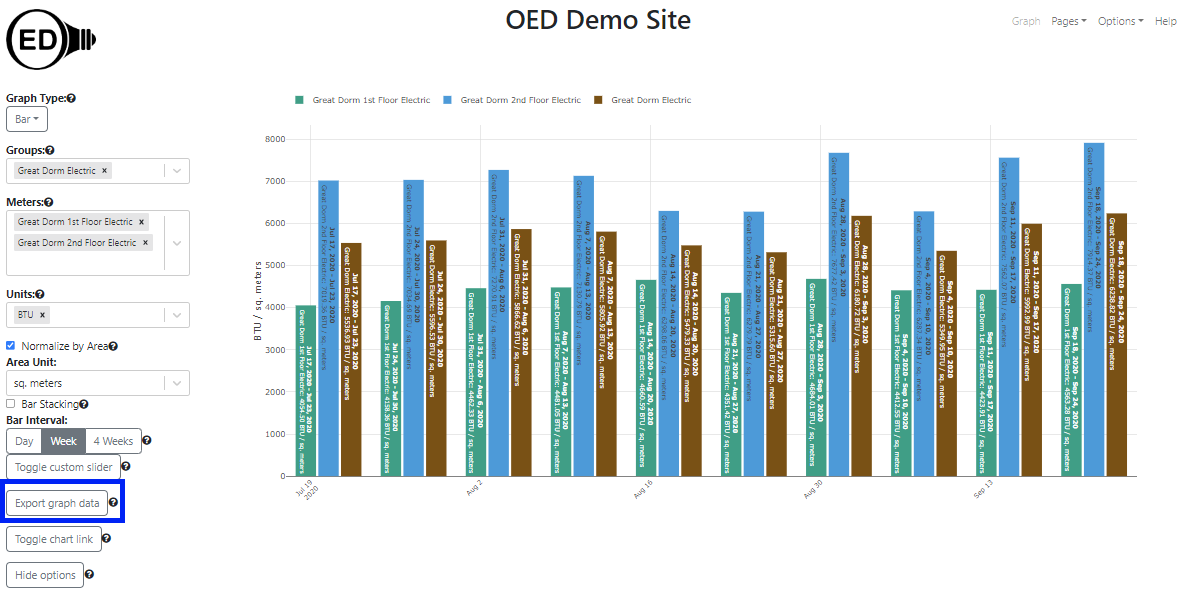
The files in this example for "Export graph data" are: Great Dorm 1st Floor Electric, Great Dorm 2nd Floor Electric and Great Dorm Electric.
You can export line and bar graphic data. You cannot export compare and map graphic data. There did not seem to be a need for compare and maps since compare has very limited data and maps are very much tied to the geographical location. Furthermore, the data shown on compare and maps is, in a general way, a subset of the bar graphic.
If different meters/groups have different ranges of dates in the meter data then it is possible for some meters/groups to have different date ranges. This will be reflected in the file name and in the data contained within the CSV file.
The time range is considered the full time shown on the line graphic (not just the zoomed in time) so you will see that unless you redraw to reduce the time range. (see redraw information)
You can import an exported line file into OED using the readings CSV import if you have administrative privileges.